System Development with Python
Week 3 :: debugging
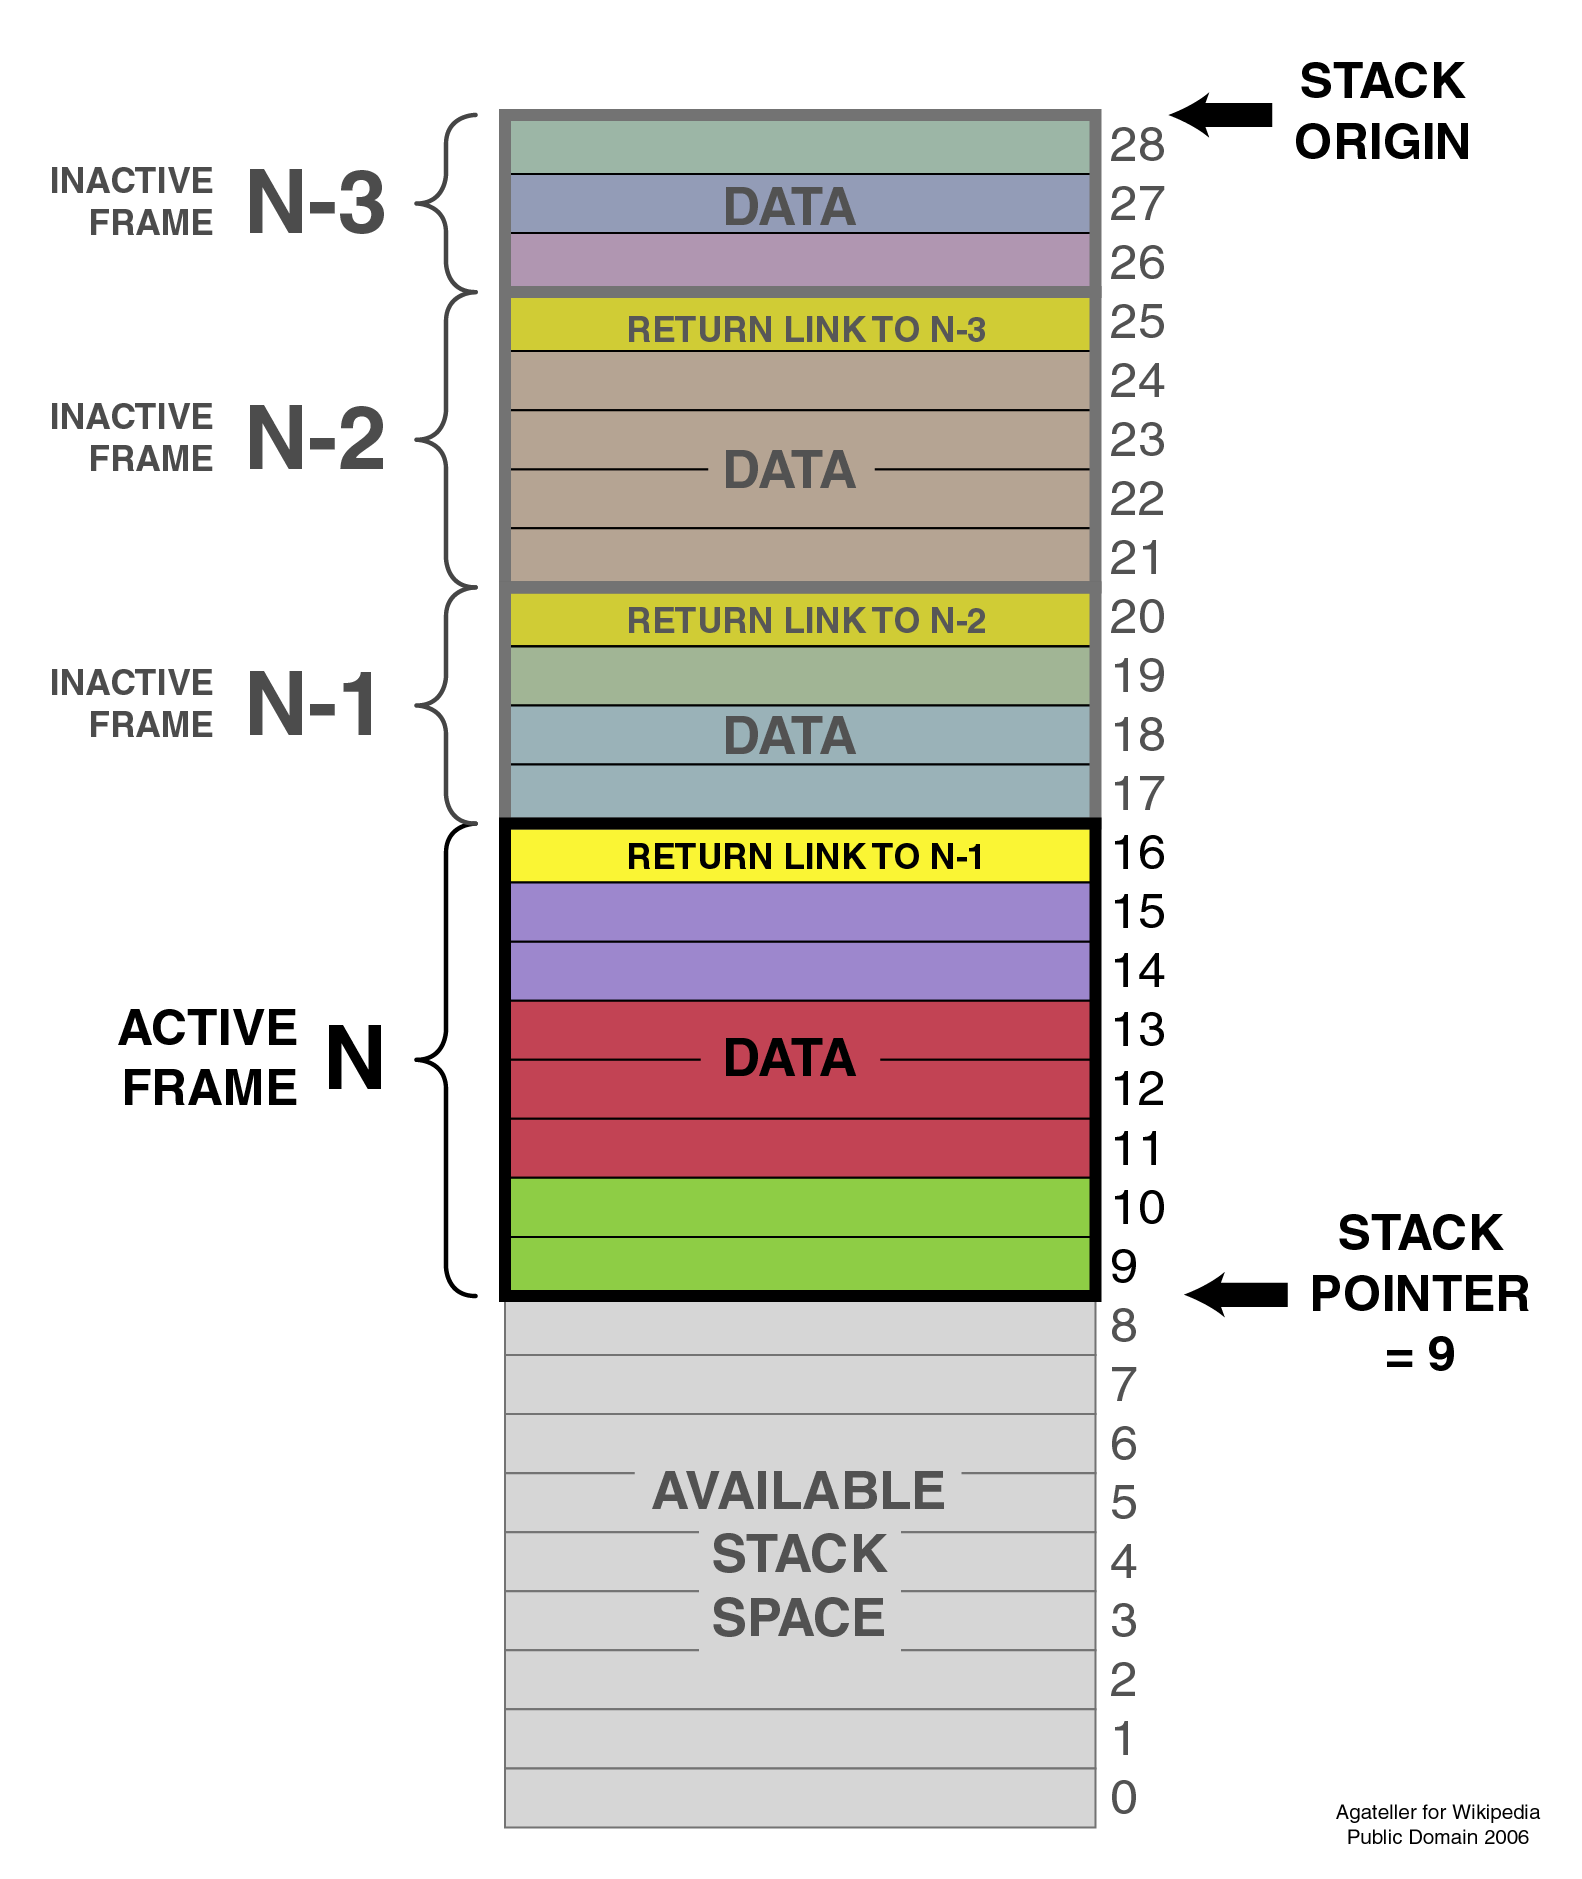
The Call Stack
What is the call stack?
- The call stack is a stack data structure that stores information about the current active function call
- A stack is a Last-In-First-Out (LIFO) data structure
- see /examples/week-03/exceptions/example_stack.py
- The objects in the stack are known as "stack frames". Each frame contains the arguments passed to the function, space for local variables, and the return address
- When a function is called, a stack frame is created for it and pushed onto the stack
- When a function returns, it is popped off the stack and control is passed to the next item in the stack. If the stack is empty, the program exits
How deep can that stack be?
see /examples/week-03/exceptions/recursion_limit.py
i = 0

def recurse():
    global i
    i += 1
    print i
    recurse()

recurse()
That value can be changed with sys.setrecursionlimit(N)
inspecting frames in the call stack
see /examples/week-03/exceptions/sys_mod_frame_inspect.py
import sys, traceback

def one():
    one_local_var = "foo"
    two()

def two():
    two_local_var = "foo"
    three()

def three():
    # print the stack
    for num in range(3):
        frame = sys._getframe(num)
        show_frame(num, frame)

    # or,
    traceback.print_stack()
    # or more rudely
    1/0

def show_frame(num, frame):
    print "  frame     = sys._getframe(%s)" % num
    print "  function  = %s()" % frame.f_code.co_name
    print "  file/line = %s:%s" % (frame.f_code.co_filename, frame.f_lineno)
    print "  locals: %s" % frame.f_locals.keys()

one()
Visualizing the Call Stack
Take a look at /examples/week-03-debugging/exceptions/visualize_frames.py
[ OUTER FRAMES ]:
module with {}
main with {'x': 'baz'}
func_one with {'y': 'baz'}
func_two with {'z': 'baz'}
you are here: file=frames_and_stacks.py line=16 function=func_two
The inspect module can do a lot, read thedocs
Exceptions
It's easier to ask for forgiveness than permission
When either the interpreter or your own code detects an error condition, an exception may be raised
The exception will bubble up the call stack until it is handled. If it's not, the interpreter will exit.
At each level in the stack, a handler can either:
- let it pass through (the default)
- swallow the exception
- catch the exception and raise it again
- catch the exception and raise a new one
Handling exceptions
The most basic form uses the builtins try and except
try:
    print "do some stuff"
    1 / 0
    print "do some more stuff"
except:
    print "stuff failed"
A few more builtins for exception handling: finally, else, and raise
def divide(x, y):
    try:
        print "line 1"
        result = x / y
        print "line 2"
    except ZeroDivisionError as e:
        print "caught division error: %s" % str(e)
    except Exception as e:
        print "exception %s. message: %s" % (type(e), e.args)
        raise
    else:
        print "everything worked great"
        return result
    finally:
        print "this is executed no matter what"
Built-in exceptions
[name for name in dir(__builtin__) if "Error" in name]If one of these meets your needs, by all means use it. Else, define a new exception type by subclassing one, perhaps Exception
In [32]: import exceptions
In [33]: exceptions?
Type:       module
String Form:
Docstring:
Python's standard exception class hierarchy.

Exceptions found here are defined both in the exceptions module and the
built-in namespace
User Defined Exceptions
Sometimes you need to create your own
class CustomException( Exception ):
    pass

raise CustomException( 'pass an error message here' )
It's that simple
Exercise
Modify the example program examples/week-03/wikidef/
- Enforce the title argument to api.Wikipedia.article() to have length greater than 0
- If a 0 length argument is passed to this function, raise a new exception called ZeroLengthTitleError
Further reading
Python Debugging
Debuggers are code which allows the inspection of state of other code during runtime.
Rudimentary tools
- print()
- interpreter hints
- import logging.debug
- assert()
Console debuggers
- pdb/ipdb
GUI debuggers
- Winpdb
- IDEs: Eclipse, Wing IDE, PyCharm, Visual Studio
help from the interpreter
investigate import issues with -v
inspect environment after running script with -i
the logging module
A flexible logging system that comes with the standard library
Any module using the logging api can have logging output routed the same as your code
The four main classes of logging
- Loggers - the interface for your code
- Handlers - handle log routing
- Filters - define which log messages to let through
- Formatters - how the log messages get rendered
basic logging usage
Basic handling, filtering, and formatting can be done through the logging module's basicConfig method
More complex and configurable configurations can be created with the class interfaces for each of those tasks
Timestamps can be included by passing the kwarg format='%(asctime)s %(message)s') to basicConfig
  import logging

  logging.basicConfig(filename='example.log', level=logging.DEBUG)
  logging.debug("debug level message")
  logging.warning("debug level message")
see examples/logging/example1.py
A more complex logging setup
  import logging

  # create logger
  logger = logging.getLogger('simple_example')
  logger.setLevel(logging.DEBUG)

  # create console handler and set level to debug
  handler = logging.StreamHandler()
  handler.setLevel(logging.DEBUG)

  # create formatter
  formatter = logging.Formatter('%(asctime)s - %(name)s - %(levelname)s - %(message)s')

  # add formatter to handler
  handler.setFormatter(formatter)

  # add handler to logger
  logger.addHandler(handler)

  # 'application' code
  logger.debug('debug message')
  logger.info('info message')
  logger.warn('warn message')
  logger.error('error message')
  logger.critical('critical message')
logging.handers Examples
Most logging considerations revolve around the different handlers
Let's play with some of the code in /examples/week-03/logging/
Pdb - The Python Debugger
Pros:
- You have it already, ships with the standard library
- Easy remote debugging
- Works with any development environment
Cons:
- Steep-ish learning curve
- Easy to get lost in a deep stack
- Watching variables isn't hard, but non-trivial
Pdb - The Python Debugger
The 4-fold ways of invoking pdb
- Postmortem mode
- Run mode
- Script mode
- Trace mode
Note: in most cases where you see the word 'pdb' in the examples, you can replace it with 'ipdb'. ipdb is the ipython enhanced version of pdb which is mostly compatible, and generally easier to work with. But it doesn't ship with Python.
Postmortem mode
For analyzing crashes due to uncaught exceptions
      python -i script.py
      import pdb; pdb.pm()
Run mode
pdb.run('some.expression()')
Script mode
python -m pdb script.py
"-m [module]" finds [module] in sys.path and executes it as a script
Trace mode
Insert the following line into your code where you want execution to halt:
import pdb; pdb.set_trace()
It's not always OK/possible to modify your code in order to debug it, but this is often the quickest way to begin inspecting state
Navigating pdb
The goal of each of the preceding techniques was to get to the pdb prompt and get to work inspecting state
% python -m pdb define.py robot
  pdb> break api.py:21
  # list breakpoints
  pdb> break
  pdb> clear 1
  # print lines of code in current context
  pdb> list
  # print lines in range
  pdb> list 1,28
  # print stack trace, aliased to (bt, w)
  pdb> where
  # move one level up the stack
  pdb> up
  # move one level down the stack
  pdb> down
  # execute until function returns
  pdb> return
  # Execute the current line, stop at the first possible occasion
  pdb> step
  # Continue execution until the next line in the current function is reached or it returns.
  pdb> next
  # Continue execution
  pdb> continue
Breakpoints
pdb> help break
  b(reak) ([file:]lineno | function) [, condition]
  With a line number argument, set a break there in the current
  file.  With a function name, set a break at first executable line
  of that function.  Without argument, list all breaks.  If a second
  argument is present, it is a string specifying an expression
  which must evaluate to true before the breakpoint is honored.

  The line number may be prefixed with a filename and a colon,
  to specify a breakpoint in another file (probably one that
  hasn't been loaded yet).  The file is searched for on sys.path;
  the .py suffix may be omitted.
Clear (delete) breakpoints
clear [bpnumber [bpnumber...]]
disable breakpoints
disable [bpnumber [bpnumber...]]
enable breakpoints
enable [bpnumber [bpnumber...]]
Conditional Breakpoints
      pdb> help condition
      condition bpnumber str_condition
      str_condition is a string specifying an expression which
      must evaluate to true before the breakpoint is honored.
      If str_condition is absent, any existing condition is removed;
      i.e., the breakpoint is made unconditional.
Set conditions
condition 1 x==1
Clear conditions
condition 1
see debugging/examples/long_loop.py
Invoking pdb with nose
On error condition, drop to pdb
nosetests --pdb
On test failure, drop to pdb:
nosetests --pdb-failures
Python IDEs
PyCharm
From JetBrains, and integrates some of their vast array of development tools
Free Community Edition (CE) is available
Good visual debugging support
Eclipse
A multi-language IDE
Python support via http://pydev.org/
Automatic variable and expression watching
Supports a lot of debugging features like conditional breakpoints, provided you look in the right places!
Further reading
http://pydev.org/manual_adv_debugger.htmlwinpdb
A multi platform Python debugger with threading support
Easier to start up and get debugging
winpdb your_app.py
Remote debugging with winpdb
To debug an application running a different Python, even remotely:
import rpdb2; rpdb2.start_embedded_debugger("password")
Debugging exercise
Find the wikidef app in the examples folder
Using (i)pdb in module mode (python -m pdb ) debug the app and find the server type that wikipedia is using by looking at response.headers.headers in Wikipedia.article
You can enter the debugger by running
python -m pdb ./define.py robotYou can get to the code by walking through each line with 's'tep and 'n'ext commands, or by setting a breakpoint and 'c'ontinuing.
What's the result?
Questions?
/