Debugging
System Development with Python
- Maria McKinley
parody@uw.edu
Topics
- The call stack
- Exceptions
- Debugging
The Call Stack
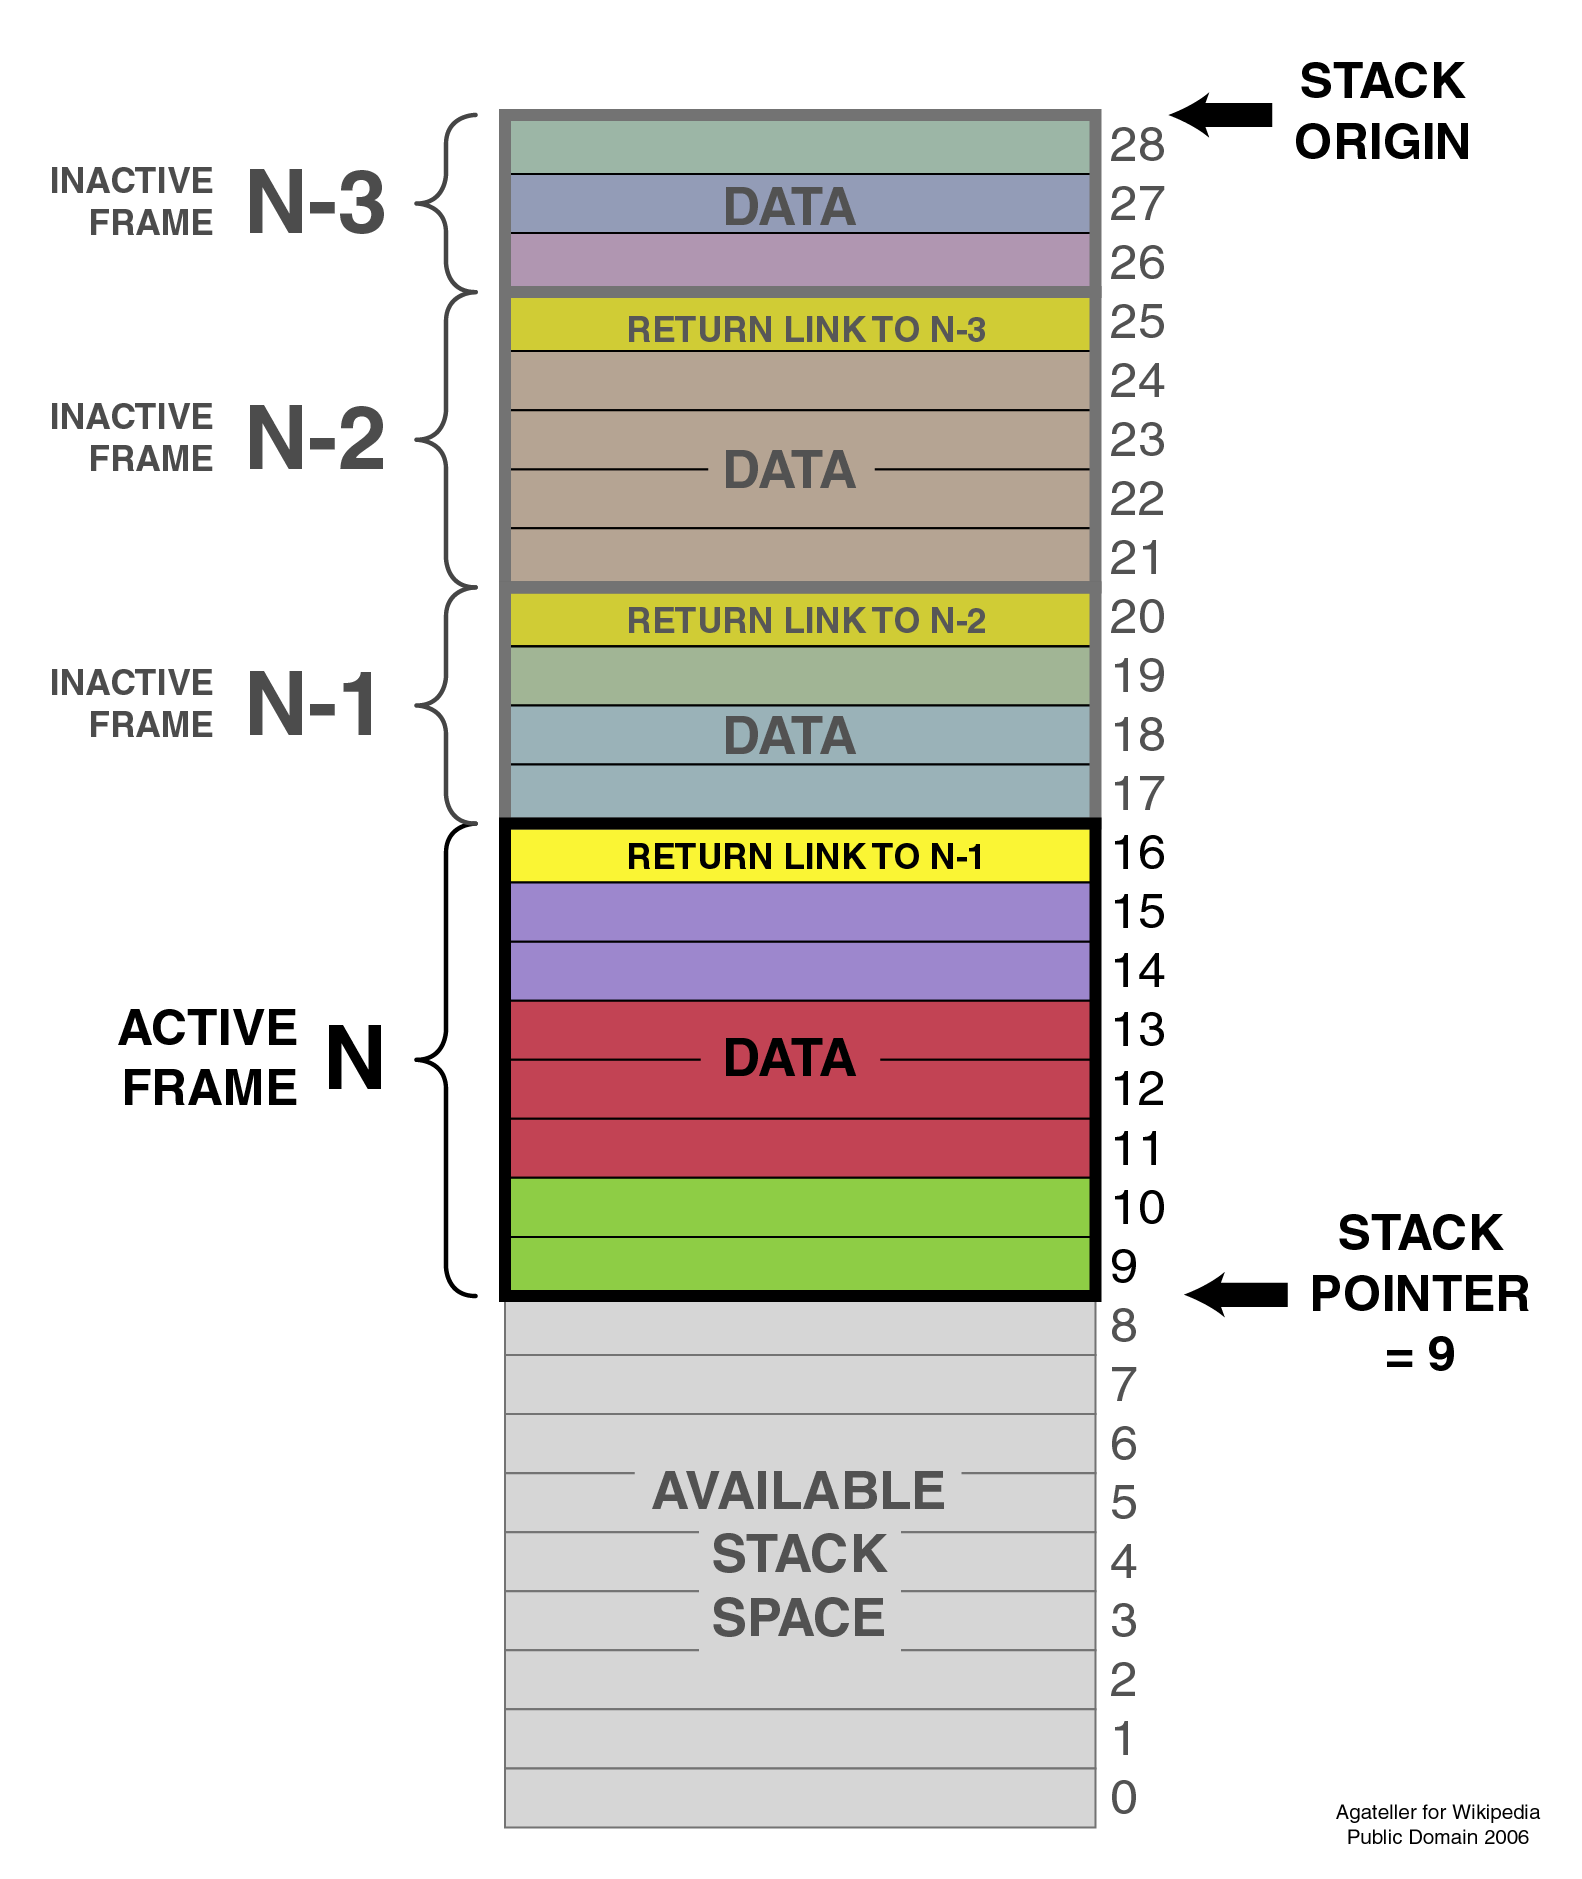
- A stack is a Last-In-First-Out (LIFO) data structure (stack of plates)
- The call stack is a stack data structure that stores information about the current active function call
- The objects in the stack are known as “stack frames”. Each frame contains the arguments passed to the function, space for local variables, and the return address
- It is usually (unintuitively) displayed like an upside-down stack of plates, with most recent frame on the bottom.
- When a function is called, a stack frame is created for it and pushed onto the stack
- When a function returns, it is popped off the stack and control is passed to the next item in the stack. If the stack is empty, the program exits
Visualize the stack!
How deep can that stack be?
i = 0

def recurse():
    global i
    i += 1
    print i
    recurse()

recurse()
That value can be changed with sys.setrecursionlimit(N)
If we try to put more than sys.getrecursionlimit() frames on the stack, we get a RuntimeError, which is python’s version of StackOverflow
import inspect

def recurse(limit):
    local_variable = '.' * limit
    print(limit, inspect.getargvalues(inspect.currentframe()))
    if limit <= 0:
        return
    recurse(limit - 1)
    return

if __name__ == '__main__':
    recurse(3)
Exceptions
It’s easier to ask for forgiveness than permission
When either the interpreter or your own code detects an error condition, an exception will be raised
The exception will bubble up the call stack until it is handled. If it’s not handled by the bottom of the stack, the interpreter will exit the program.
At each level in the stack, a handler can either:
- let it bubble through (the default)
- swallow the exception
- catch the exception and raise it again
- catch the exception and raise a new one
Handling exceptions
The most basic form uses the builtins try and except
def temp_f_to_c(var):
    try:
        return(float(var) - 32)/1.8000
    except ValueError as e:
        print("The argument does not contain numbers\n", e)
A few more builtins for exception handling: finally, else, and raise
try:
    result = x / y
except (ZeroDivisionError, ValueError) as e:
    print("caught division error or maybe a value error:\n", e)
except Exception as e:
    errno, strerror = e.args
    print("I/O error({0}): {1}".format(errno,strerror))
    # or you can just print e
    print("unhandled exception:\n", e)
    raise
else:
    print("everything worked great")
    return result
finally:
    print("this is executed no matter what")
print('this is only printed if there is no exception')
It is even possible to use a try block without the exception clause:
try:
    5/0
finally:
    print('did it work?')
Built-in exceptions
[name for name in dir(__builtin__) if "Error" in name]
If one of these meets your needs, by all means use it. You can add messages:
raise SyntaxError("That was a mispelling")
If no builtin exceptions work, define a new exception type by subclassing Exception.
class MyException(Exception):
    pass

raise MyException("An exception doesn't always prove the rule!")
It is possible, but discouraged to catch all exceptions.
try:
    my_cool_code()
except:
    print('no idea what the exceptions is, but I caught it')
An exception to this exception rule is when you are running a service that should not ever crash, like a web server.
In this case, it is extremely important to have very good logging so that you have reports of exactly what happened and what exception should have been thrown.
Further reading
Debugging
Python Debugging
You will spend most of your time as a developer debugging. You will spend more time than you expect on google.
The Stack Trace
You already know what it looks like. Simple traceback:
$ python3 test_trie.py
Traceback (most recent call last):
   File "test_trie.py", line 3, in <module>
     from trie import Trie
   File "/Users/maria/python/trie/trie.py", line 144
     print "end of word", node.value
                  ^
SyntaxError: Missing parentheses in call to 'print'
But things can quickly get complicated (Here is ~1/3 of a recent traceback I had):
- Traceback (most recent call last):
- File “snapi3/tests/test_proxy_rest.py”, line 21, in test_http_get
- resp = self.app.get(self.TRIVIAL_URL, status=200)
- File “python3/lib/python3.5/site-packages/webtest/app.py”, line 323, in get
- expect_errors=expect_errors)
- File “python3/lib/python3.5/site-packages/webtest/app.py”, line 606, in do_request
- res = req.get_response(app, catch_exc_info=True)
- File “python3/lib/python3.5/site-packages/webob/request.py”, line 1313, in send
- application, catch_exc_info=True)
- File “python3/lib/python3.5/site-packages/webob/request.py”, line 1284, in call_application
- output.extend(app_iter)
Debuggers are code which allows the inspection of state of other code during runtime.
Rudimentary tools
- print()
- interpreter hints
- import logging.debug
- assert()
Console debuggers
- pdb/ipdb
GUI debuggers
- Winpdb
- IDEs: Eclipse, Wing IDE, PyCharm, Visual Studio
help from the interpreter
- investigate import issues with -v:
python -v myscript.py
Verbose (trace import statements)
- inspect environment after running script with -i
python -i myscript.py
Forces interpreter to remain active, and still in scope
Pros:
- You have it already, ships with the standard library
- Easy remote debugging
- Works with any development environment
Cons:
- Steep-ish learning curve
- Easy to get lost in a deep stack
- Watching variables isn’t hard, but non-trivial
The 4-fold ways of invoking pdb
- Postmortem mode
- Run mode
- Script mode
- Trace mode
Note: in most cases where you see the word ‘pdb’ in the examples, you can replace it with ‘ipdb’. ipdb is the ipython enhanced version of pdb which is mostly compatible, and generally easier to work with. But it doesn’t ship with Python.
Postmortem mode
For analyzing crashes due to uncaught exceptions
python -i script.py
import pdb; pdb.pm()
Run mode
pdb.run('some.expression()')
Script mode
python -m pdb script.py
“-m [module]” finds [module] in sys.path and executes it as a script
Trace mode
Insert the following line into your code where you want execution to halt:
import pdb; pdb.set_trace()
It’s not always OK/possible to modify your code in order to debug it, but this is often the quickest way to begin inspecting state
pdb in ipython
In [2]: pdb
Automatic pdb calling has been turned ON

%run app.py

# now halts execution on uncaught exception
If you forget to turn on pdb, the magic command %debug will activate the debugger (in ‘post-mortem mode’).
The goal of each of the preceding techniques was to get to the pdb prompt and get to work inspecting state. Most commands can be short-cutted to the first letter.
% python -m pdb define.py
pdb> args  # print arguments and values to current function
pdb> pp a_variable  # pretty-print a_variable
pdb> where  # print stack trace, bottom is most recent command
pdb> list  # list the code including and surrounding the current running code
To repeat the current command, press only the Enter key
# execute until current function returns
pdb> return
# Execute the current line, stop at the first possible occasion
pdb> step
# Continue execution until the next line in the current function is reached or it returns.
pdb> next
# Continue execution until the line with a number greater than the current one is reached
  or until the current frame returns.  Good for exiting loops.
pdb> until
# move one level up the stack
pdb> up
# move one level down the stack
pdb> down
pdb> continue  # goes until next breakpoint or end of program
# advanced: create commands to be executed on a breakpoint
pdb> commands
Breakpoints
pdb> help break
  b(reak) ([file:]lineno | function) [, condition]
  With a line number argument, set a break there in the current
  file.  With a function name, set a break at first executable line
  of that function.  Without argument, list all breaks.  If a second
  argument is present, it is a string specifying an expression
  which must evaluate to true before the breakpoint is honored.

  The line number may be prefixed with a filename and a colon,
  to specify a breakpoint in another file (probably one that
  hasn't been loaded yet).  The file is searched for on sys.path;
  the .py suffix may be omitted.
Can use up, down, where and list to evalutate where you are, and use that to set a new breakpoint in code coming up. Useful for getting out of rabbit holes.
pdb> break api.py:21 set a breakpoint file:line #
pdb> break  # list breakpoints
pdb> clear 1  # get rid of first breakpoint
pdb> break 35  # set a breakpoint in current file at line 35
# print lines in range
pdb> list 1,28
Clear (delete) breakpoints
clear [bpnumber [bpnumber...]]
disable breakpoints
disable [bpnumber [bpnumber...]]
enable breakpoints
enable [bpnumber [bpnumber...]]
Conditional Breakpoints
pdb> help condition
condition bpnumber str_condition
str_condition is a string specifying an expression which
must evaluate to true before the breakpoint is honored.
If str_condition is absent, any existing condition is removed;
i.e., the breakpoint is made unconditional.
Invoking pdb with nose
On error condition, drop to pdb
nosetests --pdb
On test failure, drop to pdb:
nosetests --pdb-failures
Python IDEs
PyCharm
From JetBrains, and integrates some of their vast array of development tools
Free Community Edition (CE) is available
Good visual debugging support
Eclipse
A multi-language IDE
Python support via http://pydev.org/
Automatic variable and expression watching
Supports a lot of debugging features like conditional breakpoints, provided you look in the right places!
Further reading
http://pydev.org/manual_adv_debugger.html
winpdb
A multi platform Python debugger with threading support
Easier to start up and get debugging
winpdb your_app.py
Remote debugging with winpdb
To debug an application running a different Python, even remotely:
import rpdb2; rpdb2.start_embedded_debugger("password")
http://winpdb.org/tutorial/WinpdbTutorial.html
Debugging exercise
Find the wikidef app in the examples folder
See if you can find the bug and get the app working. Use whatever debugging technique(s) you prefer.
To run the app:
python define.py interesting_topic
where interesting_topic is a topic of interest. ;-)
Once it is working again: Using (i)pdb in module mode (python -m pdb ) to find the server type that wikipedia is using by looking at response.headers.headers in Wikipedia.article
You can enter the debugger by running
python -m pdb ./define.py robot
(define.py takes the first sys arg and finds articles on wikipedia on that topic)
You can get to the code by walking through each line with ‘s’tep and ‘n’ext commands, or by setting a breakpoint and ‘c’ontinuing.
What’s the result?
Questions?