Debugging
System Development with Python
Maria McKinley
parody@uw.edu
Topics
The call stack
Exceptions
Debugging
The Call Stack
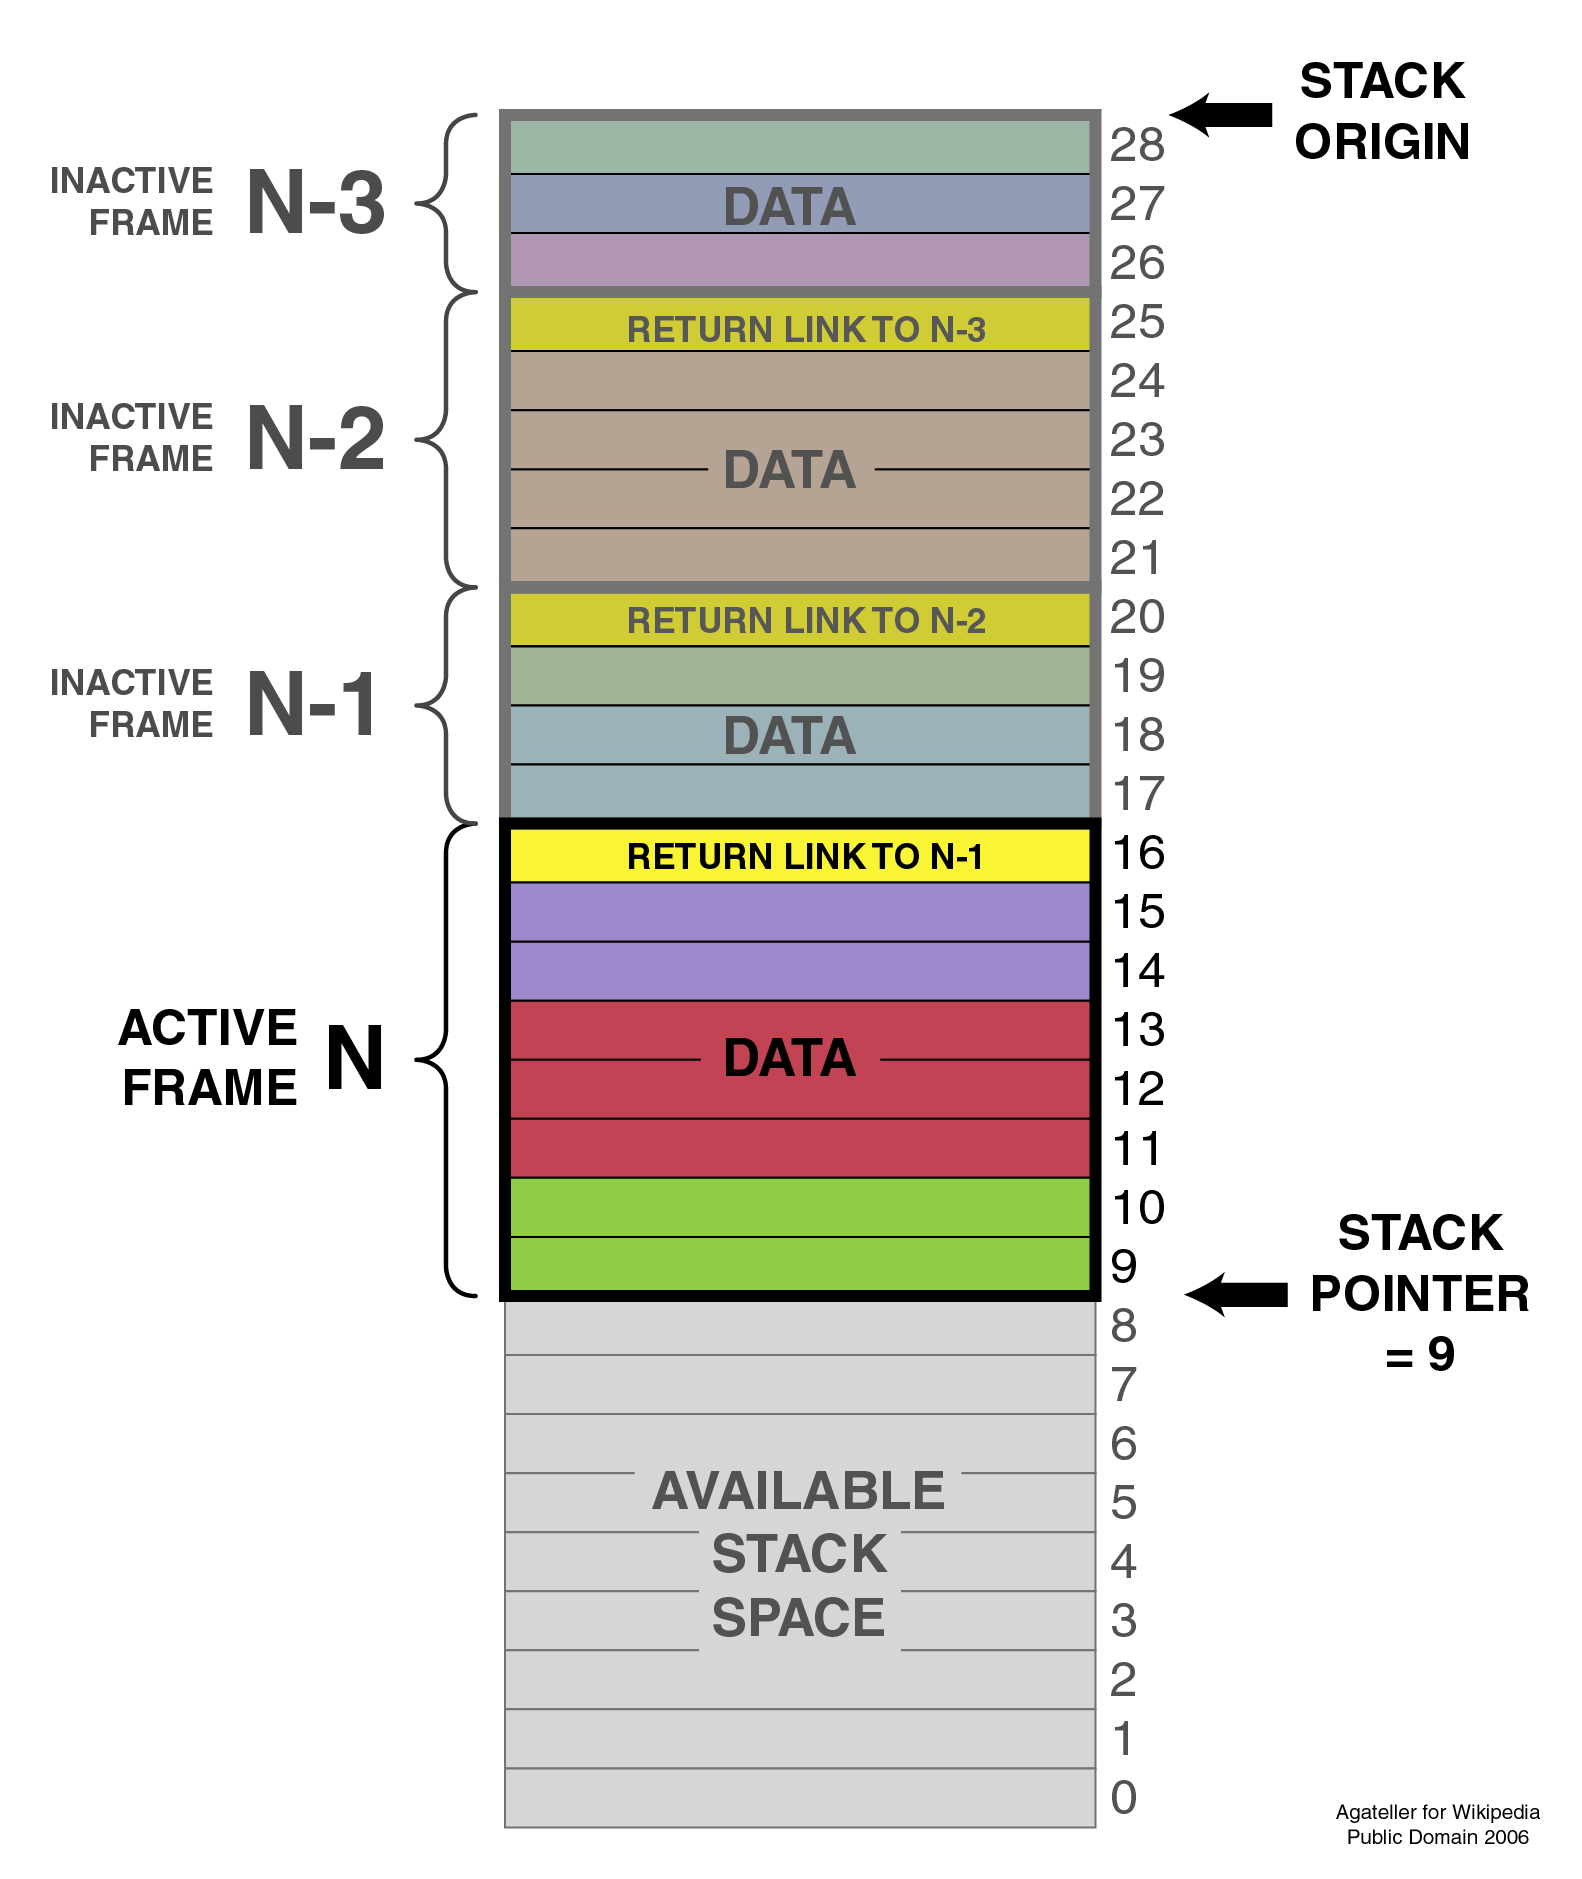
A stack is a Last-In-First-Out (LIFO) data structure (stack of plates)
The call stack is a stack data structure that stores information about the current active function calls
The objects in the stack are known as “stack frames”. Each frame contains the arguments passed to the function, space for local variables, and the return address
It is usually (unintuitively) displayed like an upside-down stack of plates, with most recent frame on the bottom.
When a function is called, a stack frame is created for it and pushed onto the stack
When a function returns, it is popped off the stack and control is passed to the next item in the stack. If the stack is empty, the program exits
Visualize the stack!
How deep can that stack be?
i = 0

def recurse():
    global i
    i += 1
    print(i)
    recurse()

recurse()
That value can be changed with sys.setrecursionlimit(N)
If we try to put more than sys.getrecursionlimit() frames on the stack, we get a RecursionError (derived from RuntimeError), which is python’s version of StackOverflow
import inspect

def recurse(limit):
    local_variable = '.' * limit
    print(limit, inspect.getargvalues(inspect.currentframe()))
    if limit <= 0:
        return
    recurse(limit - 1)
    return

recurse(3)
module https://docs.python.org/3/library/inspect.html
more on recursion http://www.mariakathryn.net/Blog/60
Exceptions
It’s easier to ask for forgiveness than permission (Grace Hopper)
When either the interpreter or your own code detects an error condition, an exception will be raised
The exception will bubble up the call stack until it is handled. If it’s not handled anywhere in the stack, the interpreter will exit the program.
At each level in the stack, a handler can either:
let it bubble through (the default if no handler)
swallow the exception (the default for a handler)
catch the exception and raise it again
catch the exception and raise a new one
Handling exceptions
The most basic form uses the builtins try and except
def temp_f_to_c(var):
    try:
        return(float(var) - 32)/1.8000
    except ValueError as e:
        print("The argument does not contain numbers\n", e)
A few more builtins for exception handling: finally, else, and raise
x = 5
y = "this"

try:
    result = x / y
except (ZeroDivisionError, ValueError) as e:
    print("caught division error or maybe a value error:\n", e)
except Exception as e:  # only do this if absolutely necessary, or if planning to re-raise
    errors = e.args
    print("Error({0})".format(errors))
# or you can just print e
    print("unhandled, unexpected exception:\n", e)
    raise
else:
    print("do this if there is code you want to run only if no exceptions, caught or not")
    print("errors here will not be caught by above excepts")
finally:
    print("this is executed no matter what")
print('this is only printed if there is no uncaught exception')
It is even possible to use a try block without the exception clause:
try:
    5/0
finally:
    print('did it work? why would you do this?')
Built-in exceptions
[name for name in dir(__builtin__) if "Error" in name]
If one of these meets your needs, by all means use it. You can add messages:
raise SyntaxError("That was a mispelling")
If no builtin exceptions work, define a new exception type by subclassing Exception.
class MyException(Exception):
    pass

raise MyException("An exception doesn't always prove the rule!")
It is possible, but discouraged to catch all exceptions.
try:
    my_cool_code()
except:
    print('no idea what the exceptions is, but I caught it')
An exception to this exception rule is when you are running a service that should not ever crash, like a web server. In this case, it is extremely important to have very good logging so that you have reports of exactly what happened and what exception would have been thrown.
Further reading
Debugging
Python Debugging
You will spend most of your time as a developer debugging.
You will spend more time than you expect on google.
Small, tested functions are easier to debug.
Find a bug, make a test, so it doesn’t come back
Tools
interpreter hints
print()
logging
assert()
tests
debuggers
The Stack Trace
You already know what it looks like. Simple traceback:
maria$ python3 define.py python
Traceback (most recent call last):
  File "define.py", line 15, in <module>
    definition = Definitions.article(title)
  File "/Users/maria/python/300/Py300/Examples/debugging/wikidef/definitions.py", line 7, in article
    return Wikipedia.article(title)
  File "/Users/maria/python/300/Py300/Examples/debugging/wikidef/api.py", line 26, in article
    contents = json_response['parse']['text']['*']
TypeError: 'method' object is not subscriptable
But things can quickly get complicated. You may have already run into stacktraces that go on for a 50 lines or more.
Some helpful hints with stacktraces:
May seem obvious, but… Read it carefully!
What is the error? Try reading it aloud.
The first place to look is the bottom.
Trace will show the line number and file of exception/calling functions.
More than likely the error is in your code, not established packages - look at lines in your code mentioned in the stacktrace first - Sometimes that error was triggered by something else, and you need to look higher. (probably more than one file in the stacktrace is your code)
If that fails you…
Make sure the code you think is executing is really executing.
Simplify your code (smallest code that causes bug).
Debugger
Save (and print) intermediate results from long expressions
Try out bits of code at the command line
If all else fails…
Write out an email that describes the problem:
include the stacktrace
include steps you have taken to find the bug
inlude the relative function of your code
Often after writing out this email, you will realize what you forgot to check, and more often than not, this will happen just after you hit send. Good places to send these emails are other people on same project and mailing list for software package. For the purpose of this class, of course, copy it into slack or the class email list.
Print
print(“my_module.py: my_variable: “, my_variable)
can use print statements to make sure you are editing a file in the stack
Console Debuggers
pdb/ipdb
GUI debuggers (more about these below)
Winpdb
IDEs: Eclipse, Wing IDE, PyCharm, Visual Studio Code
help from the interpreter
investigate import issues with -v:
python -v myscript.py
Verbose (trace import statements)
inspect environment after running script with -i
python -i myscript.py
Forces interpreter to remain active, and still in scope
Useful tools from interpreter:
In IPython, ‘who’ will list all currently defined variables
locals()
globals()
dir()
Pros:
You have it already, ships with the standard library
Easy remote debugging (since it is non-graphical, see remote-pdb for true remote debugging)
Works with any development environment
Cons:
Steep-ish learning curve
Easy to get lost in a deep stack
Watching variables isn’t hard, but non-trivial
The 4-fold ways of invoking pdb
Postmortem mode
Run mode
Script mode
Trace mode
Note: in most cases where you see the word ‘pdb’ in the examples, you can replace it with ‘ipdb’. ipdb is the ipython enhanced version of pdb which is mostly compatible, and generally easier to work with. But it doesn’t ship with Python.
Postmortem mode
For analyzing crashes due to uncaught exceptions
python -i script.py
import pdb; pdb.pm()
More info on using Postmortem mode:
http://www.almarklein.org/pm-debugging.html
Run mode
pdb.run('some.expression()')
Script mode
python -m pdb script.py
“-m [module]” finds [module] in sys.path and executes it as a script
Trace mode
Insert the following line into your code where you want execution to halt:
import pdb; pdb.set_trace()
It’s not always OK/possible to modify your code in order to debug it, but this is often the quickest way to begin inspecting state
pdb in ipython
In [2]: pdb
Automatic pdb calling has been turned ON

%run app.py

# now halts execution on uncaught exception
If you forget to turn on pdb, the magic command %debug will activate the
debugger (in ‘post-mortem mode’).
The goal of each of the preceding techniques was to get to the pdb prompt and get to work inspecting state. Most commands can be short-cutted to the first letter.
% python -m pdb define.py
pdb> args  # print arguments and values to current function
pdb> pp a_variable  # pretty-print a_variable
pdb> where  # print stack trace, bottom is most recent command
pdb> list  # list the code including and surrounding the current running code
To repeat the current command, press only the Enter key
# execute until current function returns
pdb> return
# Execute the current line, stop at the first possible occasion
pdb> step
# Continue execution until the next line in the current function is reached or it returns.
pdb> next
# Continue execution until the line with a number greater than the current one is reached
  or until the current frame returns.  Good for exiting loops.
pdb> until
# move one level up the stack
pdb> up
# move one level down the stack
pdb> down
pdb> continue  # goes until next breakpoint or end of program
# advanced: create commands to be executed on a breakpoint
pdb> commands
Breakpoints
pdb> help break
  b(reak) ([file:]lineno | function) [, condition]
  With a line number argument, set a break there in the current
  file.  With a function name, set a break at first executable line
  of that function.  Without argument, list all breaks.  If a second
  argument is present, it is a string specifying an expression
  which must evaluate to true before the breakpoint is honored.

  The line number may be prefixed with a filename and a colon,
  to specify a breakpoint in another file (probably one that
  hasn't been loaded yet).  The file is searched for on sys.path;
  the .py suffix may be omitted.
Can use up, down, where and list to evalutate where you are, and use that to set a new breakpoint in code coming up. Useful for getting out of rabbit holes.
pdb> break api.py:21 # set a breakpoint file:line #
pdb> break  # list breakpoints
pdb> clear 1  # get rid of first breakpoint
pdb> break 35  # set a breakpoint in current file at line 35
# print lines in range
pdb> list 1,28
You can also delete(clear), disable and enable breakpoints
clear [bpnumber [bpnumber...]]

disable [bpnumber [bpnumber...]]

enable [bpnumber [bpnumber...]]
Conditional Breakpoints
pdb> break 9, j>3
Breakpoint 1 at .../pdb_break.py:9

pdb> break
Num Type         Disp Enb   Where
1   breakpoint   keep yes   at .../pdb_break.py:9
        stop only if j>3
Condition can be used to add a conditional to an existing breakpoint
Invoking pdb with pytest
pytest allows one to drop into the PDB prompt via a command line option:
pytest --pdb
This will invoke the Python debugger on every failure. Often you might only want to do this for the first failing test to understand a certain failure situation:
pytest -x --pdb   # drop to PDB on first failure, then end test session
pytest --pdb --maxfail=3  # drop to PDB for first three failures
Try some debugging! Here is a fun tutorial intro to pdb that someone created:
Python IDEs
PyCharm
From JetBrains, — integrates some of their vast array of development tools
Free Community Edition (CE) is available
Good visual debugging support
Eclipse
A multi-language IDE
Python support via http://pydev.org/
Automatic variable and expression watching
Supports a lot of debugging features like conditional breakpoints, provided you look in the right places!
Further reading
http://pydev.org/manual_adv_debugger.html
Visual Studio Code
Visual Studio Code has support for Python
(not the same as the monstrosity that is Visual Studio)
https://code.visualstudio.com/
winpdb
A multi platform Python debugger with threading support
Easier to start up and get debugging:
winpdb your_app.py