Performance and Profiling
Today’s topics
Determining performance objectives
Measuring performance a.k.a. profiling
Performance optimizations
What is Software Profiling
The act of using instrumentation to objectively measure the performance of your application
“Performance” can be a measure of any of the following:
resource use (CPU, memory)
frequency or duration of function calls
wall clock execution time of part or all of your application
Collecting this data involves instrumenting the code. In Python, this happens at runtime.
The instrumentation creates overhead, so it has a performance cost
The output data (a “profile”) will be a statistical summary of the execution of functions
An optimization strategy
Write the code for maintainability / readability
Test for correctness
Collect profile data
If it is fast enough, quit. Your job here is done.
Else optimize the most expensive parts based on profiling data
Repeat from 2)
Programmers waste enormous amounts of time thinking about, or worrying about, the speed of noncritical parts of their programs, and these attempts at efficiency actually have a strong negative impact when debugging and maintenance are considered. We should forget about small efficiencies, say about 97% of the time:
premature optimization is the root of all evil.
–Donald Knuth
Steps to better performance
(In order of importance)
Efficient Algorithms (big O, etc…)
Appropriate Python data types, etc.
Appropriate Python style
Specialized packages (numpy, scipy)
Calling external packages
Extending with C/C++/Fortran/Cython
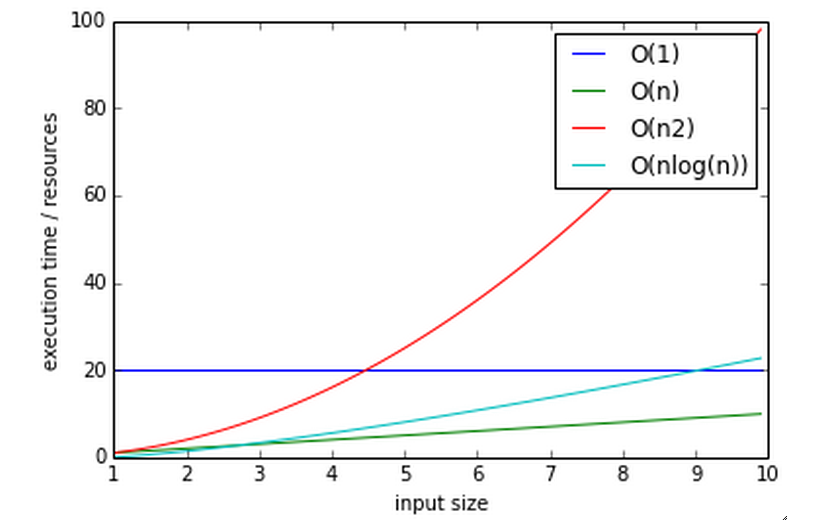
Big O notation
The efficiency of an algorithm is often described in “big O” notation.
The letter O is used because the growth rate of a function is also referred to as Order of the function
It describes how an algorithm behaves in terms of resource use as a function of amount of input data
O(1) - (Constant performance) Execution time stays constant regardless of how much data is supplied
Example: adding to a dict
O(n) - Time goes up linearly with number of items.
Example: scanning lists
O(n2) - Time goes up quadratically with number of items.
Example: bubble sort, worst case
O(log(n)) - goes up with the log of number of items
Example: bisection search
log? you expect me to remember that math???
Let’s think about that a bit….
Anyone know what a bisection search is?
Why is that O(log(n))?
Reference:
Measuring time with a stopwatch
One way to measure performance is with a stopwatch.
Start the clock when a unit of code such as a function begins, and stop it when the code returns
This is a the simplest method, and we can instrument our code to start and stop the clock.
Like most timing benchmarks, data obtained is valid only for the particular test environment (machine/OS/Python version..)
Relative timings may be valid across systems, but can also diverge
For instance a run on a machine with fast network and slow disk may produce much different results on a system with slow network and fast disk
time.clock() : time.time()
Using the time module as a profiling decorator
time.time() returns the unix system time (wall clock time)
time.clock() returns the CPU time of the current process
Precision is system dependent
Quite coarse, but can capture the big picture
See /examples/profiling/timer/timer_test.py
import time

def timer(func):
    def timer(*args, **kwargs):
        """a decorator which prints execution time of the decorated function"""
        t1 = time.time()
        result = func(*args, **kwargs)
        t2 = time.time()
        print("-- executed %s in %.4f seconds" % (func.func_name, (t2 - t1)))
        return result
    return timer

@timer
def expensive_function():
    time.sleep(1)

@timer
def less_expensive_function():
    time.sleep(.02)

expensive_function()
less_expensive_function()
timeit
Used for testing small bits of code
Use to test hypotheses about efficiency of algorithms and Python idioms
Will run the given statement many times and calculate the average execution time
Can be run from the command line:
python -m timeit '"-".join(str(n) for n in range(100))'
https://docs.python.org/3.5/library/timeit.html
See the timeit.py source:
timeit command line interface
options
-nN: execute the given statement N times in a loop. If this value is not given, a fitting value is chosen.-rR: repeat the loop iteration R times and take the best result. Default: 3-t: use time.time to measure the time, which is the default on Unix. This function measures wall time.-c: use time.clock to measure the time, which is the default on Windows and measures wall time. On Unix, resource.getrusage is used instead and returns the CPU user time.-pP: use a precision of P digits to display the timing result. Default: 3
$ python -m timeit -n 1000 -t "len([x**2 for x in range(1000)])"
timeit can also be imported as a module
http://docs.python.org/3/library/timeit.html#timeit.timeit
timeit.timeit(stmt='pass',
              setup='pass',
              timer=<default timer>,
              number=1000000)
The setup kwarg contains a string of Python code to execute before the loops start, so that code is not part of the test
import timeit
statement = "char in text"
setup_code = """text = "sample string";char = "g" """
timeit.timeit(statement, setup=setup_code)
timeit via iPython magic
Note that all that setup_code stuff is kind of a pain.
iPython has your back (again)
%timeit pass

u = None
%timeit u is None

%timeit -r 4 u == None

import time

%timeit -n1 time.sleep(2)

%timeit -n 10000 "f" in "food"
Exercise
We just tried determining if a character exists in a string:
statement = "'f' in 'food'"
timeit.timeit(statement)
Run timeit with an alternative statement:
statement2 = "'food'.find('f') >= 0"
timeit.timeit(statement2)
Which is faster? Why?
Getting more detailed with Profiling
That kind of timing is only useful if you know what part of the code you want to optimize.
But what if you know your program is “slow”, but don’t know where is is spending the time?
Do not Guess! – you will often be wrong, and you don’t want to waste time optimizing the wrong thing.
Really – even very experienced programmers are often wrong about where the bottlenecks are.
You really need to profile to be sure.
Also: take into account the entire run-time: does it make sense to optimize an initialization routine that takes a few seconds before a multi-hour run?
A profiler takes measurements of runtime performance and summarizes results into a profile report
Reported metrics could include
Memory used over time
Memory allocated per function
Frequency of function calls
Duration of function calls
Cumulative time spent in subfunction calls
Python’s built-in profilers
Python comes with a couple profiling modules
profile - older, pure Python. If you need to extend the profiler, this might be good. Otherwise, it’s slow.
cProfile - same API as profile, but written in C for less overhead
You almost always want to use ``cProfile``
cProfile
Can be run as a module on an entire application
python -m cProfile [-o output_file] [-s sort_order] read_bna.py
11111128 function calls in 8.283 seconds
Ordered by: standard name

ncalls  tottime  percall  cumtime  percall filename:lineno(function)
  1    0.000    0.000    0.000    0.000   integrate.py:1()
11111110    2.879    0.000    2.879    0.000   integrate.py:1(f)
[....]
ncalls: number of calls
tottime: total time spent in function, excluding time in sub-functions
percall: tottime / ncalls
cumtime: total time spent in function, including time in sub-functions
percall: cumtime / ncalls
filename:lineno – location of function
Analyzing profile data
Output to a binary dump with -o <filename>
While doing performance work, save your profiles for comparison later
This helps ensure that any changes do actually increase performance
A profile dump file can be read with pstats
python -m pstats
Gives you a command line interface
(help for help…)
pstats
python -m cProfile -o prof_dump  ./read_bna.py
python -m pstats
% read prof_dump

# show stats:
prof_dump% stats

# only the top 5 results:
prof_dump% stats 5

# sort by cumulative time:
prof_dump% sort cumulative

# shorten long filenames for display:
prof_dump% strip
# show results again:
prof_dump% stats 5
pstats also has method calls:
import pstats
p = pstats.Stats('prof_dump')
p.sort_stats('calls', 'cumulative')
p.print_stats()

# Output can be restricted via arguments to print_stats().
# Each restriction is either an integer (to select a count of lines),
# a decimal fraction between 0.0 and 1.0 inclusive (to select a percentage of lines),
# or a regular expression (to pattern match the standard name that is printed.
# If several restrictions are provided, then they are applied sequentially.
Analyzing profile data
Inspect only your local code with regular expression syntax:
import pstats
prof = pstats.Stats('prof_dump')
prof.sort_stats('cumulative')
prof.print_stats('^./[a-z]*.py:')
I tend to write little scripts like this so I don’t have to remember the commands.
Exercise / Example
Real world example:
Examples/profiling/bna_reader/read_bna.py
BNA is a (old) text file format for holding geospatial data.
We were using some old code of mine that read these files, generated an internal data structure of polygons, and rendered them to a PNG.
As these files got big – this process started getting really slow.
I had already optimized the file reading code a lot – so could we do better?
I assumed not
One of my team ran the profiler and identified the bottleneck – and yes – we could do better – a lot.
Let’s try that out now.
Some other tools to consider
For better visualizing
For C extensions
For memory Profiling
SNAKEVIZ
A graphical profile viewer for Python
https://jiffyclub.github.io/snakeviz/
pip install snakeviz
Inspired by “Run Snake Run”: http://www.vrplumber.com/programming/runsnakerun/
(which only works with Python 2.* for now)

line profiler
Thus far, we’ve seen how to collect data on the performance of functions as atomic units
line_profiler is a module for doing line-by-line profiling of functions
line_profiler ships with its own profiler, kernprof.py.
Enable line-by-line profiling with -l
Decorate the function you want to profile with @profile and run
# the -v option will display the profile data immediately, instead
# of just writing it to <filename.py>.lprof
$ kernprof -l -v integrate_main.py

# load the output with
$ python -m line_profiler integrate_main.py.lprof
qcachegrind / kcachegrind
profiling tool based on Valgrind:
http://kcachegrind.sourceforge.net/html/Valgrind.html
a runtime instrumentation framework for Linux/x86
Can be used with Python profile data with a profile format conversion
Doesn’t give all the information that a native valgrind run would provide
# convert python profile to calltree format
pip install pyprof2calltree

python -m cProfile -o dump.profile integrate_main.py
pyprof2calltree -i dump.profile -o dump.callgrind
http://kcachegrind.sourceforge.net/cgi-bin/show.cgi/KcacheGrindCalltreeFormat
Profiling C extensions
Google Performance Tools:
https://code.google.com/p/gperftools/
can be used to profile C extensions
Just call ProfilerStart and ProfilerStop with ctypes around the code you want to profile
import ctypes

libprof = ctypes.CDLL('/usr/local/lib/libprofiler.0.dylib')
libprof.ProfilerStart('/tmp/out.prof')
import numpy
a=numpy.linspace(0,100)
a*=32432432
libprof.ProfilerStop('/tmp/out.prof')
# convert the profile to qcachegrind's format with google's pprof tool
$ pprof --callgrind  ~/virtualenvs/uwpce/lib/python2.7/site-packages/numpy/core/multiarray.so out.prof > output.callgrind
$ qcachegrind output.callgrind
memory profilers
There aren’t any great ones
One option is heapy, which comes with Guppy, a Python environment for memory profiling
from guppy import hpy; hp=hpy()
hp.doc.heap
hp.heap()
%run define.py Robot
hp.heap()
Others:
https://pypi.python.org/pypi/memory_profiler
Boosting Python performance
There are ways to better structure your Python code to improve performance
A few key approaches
Overhead in function/method runtime lookup can be significant for small frequent calls.
inlining code or caching function results might help.
Python string handling idioms: use
"".join(list_of_strings)rather than sequential calls to += Seeexamples/strings/str_concat.pyandstr_comprehensions.pyusing list comprehensions, generator expressions,
or map()instead of for loops can be faster (seedata_aggregation/loops.py)Leverage existing domain specific C extension libraries, for instance numpy for fast array operations.
Rewrite expensive code as C modules. Use ctypes, Cython, SWIG, …
Managing memory
Don’t forget memory:
Processors are fast
It can take longer to push the memory around than do the computation
So keep in mind for big data sets:
Use the right data structures
Use efficient algorithms
Use generators and iterators, rather than lists.
Use iterators to pull in the data you need from databases, sockets, files, …
Distraction: pyGame
There is a nice profiling example that uses PyGame:
http://www.pygame.org/hifi.html
Which you can install from binaries:
Windows: http://www.lfd.uci.edu/~gohlke/pythonlibs/#pygame
(you want the wheel file for the python you are running: probably cp35)
Anaconda Python:
First install miniconda. Then you can install pygame from anaconda.org.
A more complex profile
The amount of data in the previous example is readable, so now we’ll look at the output from a more complex application: examples/profiling/pygame/swarm.py
This program consists of calculating the gravitational acceleration of bodies around a central mass and displaying them
There are two major consumers of resources: one is our own code calculating the physics, the other is pygame drawing the results on the screen
Our goal is to figure out whether the major bottleneck is in our own logic or in the pygame operations
A simple way to get data for our own code is
python -m cProfile swarm.py  &> /tmp/output.txt
grep swarm.py /tmp/output.txt